Our analysis
The financial data that we analyzed included the daily price and volume of each stock in the S&P 500, over a period of 15 years.
In addition, we had the daily price of the S&P 500 index itself.
We used our technologies for data mining, behavior analysis and pattern recognition to identify for a given period of time (for example, a week of daily prices),
all the historical time periods that have the same behavior and pattern. Then, we analyzed the future of these past periods of time to predict the future
of the given time period. This way we could detect trends and provide trading recommendation.
Our trend detection and recommendation were based on multi-scale analysis of the historical data, where each scale represents a different time scale (for example,
1 day, 1 week, 2 weeks, 3 weeks etc). Then, we used our fusion techniques to ensemble the different scales and to provide a trend prediction.
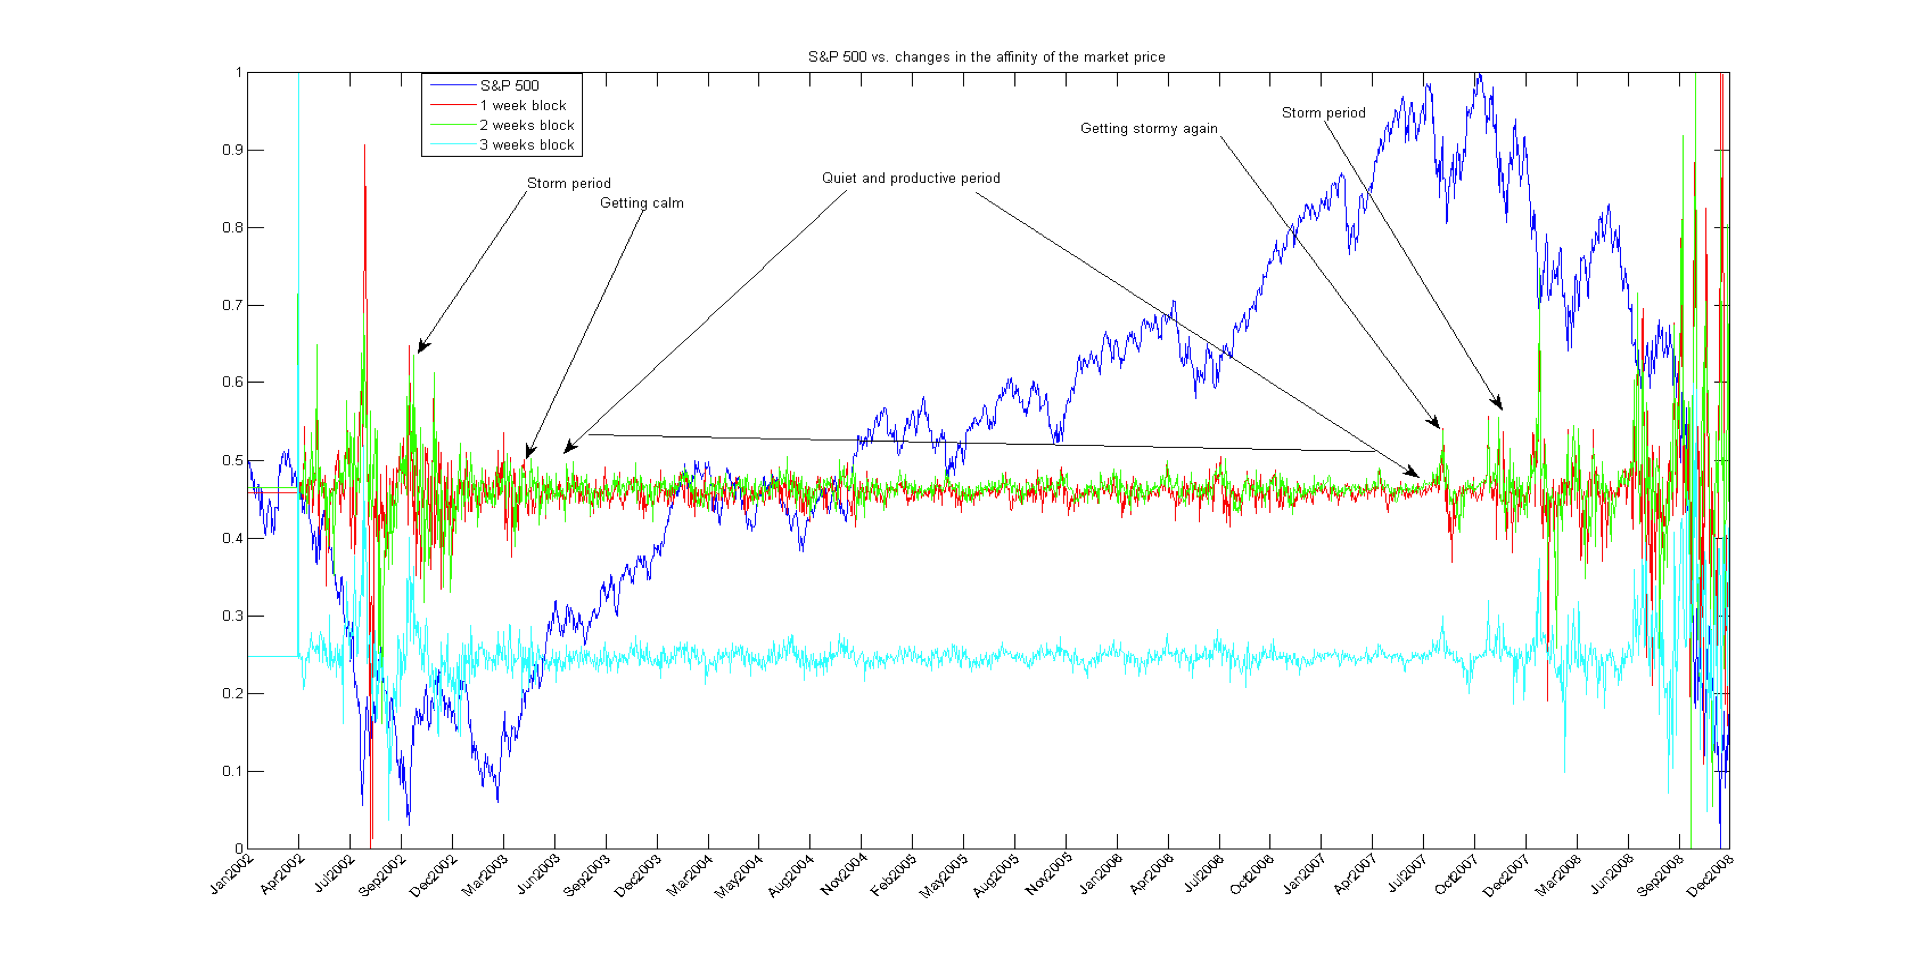
In the following example, we analyzed consecutive time periods of price data in different scales. This graph describes the changes of this function over time and it finds
some interesting patterns and cycles. We can see that in the
first period of time (2002-2003), the graph is very stormy but at the beginning of 2003 it is getting calm.
Then, from 2003 to the end of 2007, the graph is very "quiet" while the S&P 500 is rising. At the end of 2007, the graph is getting stormy again
and it might predict that the quiet period is over. Indeed, at the beginning of 2008, the S&P 500 is crashing and the graph becomes very stormy again.
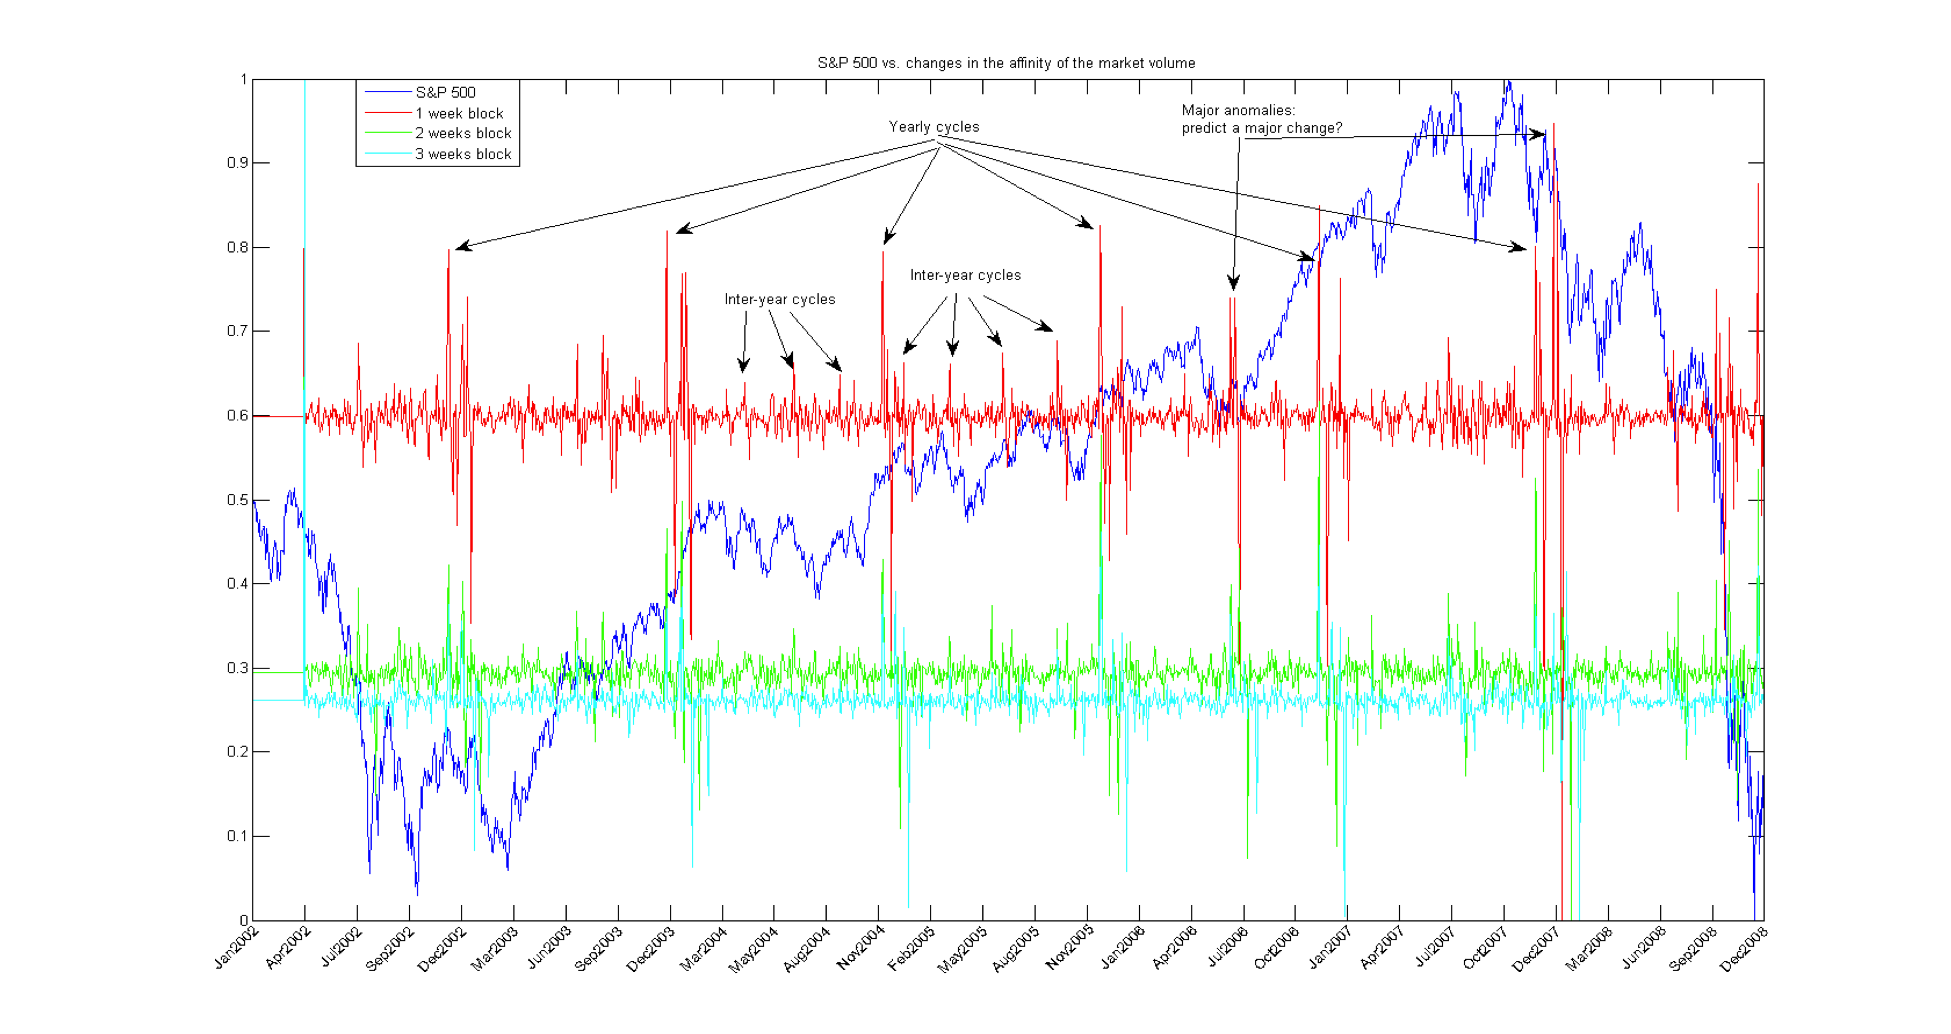
In the next example, we repeated this process but this time we used the volume data.
We can see that there are minor inter-year cycles and major yearly cycles (changes at the end of each year).
However, in some areas in the graph there are major changes that are not part of the regular cycles - these major changes might predict
a major change in the market. For example, on July 2008 was a major change and afterward the S&P sharply increased; at the end of 2007, the end of
year change was much bigger then the yearly cycles in the past and indeed the S&P crashed since then.
We used the above methods to build a prediction for the future period of time according to the (already known) future of the
past periods of time. This technology was evaluated using a very basic trading strategy: starting in 1996,
we used our trend prediction in order to decide whether the market is going to rise or fall at the end of the next period of time and then we
"long" or "short" accordingly. We continued with this strategy from 1996 to 2010 and compared our performance (profit) to the S&P 500 performance.
In the following example we can see the percentage of the profit that we gained at the end of these 15 years (the red line is the S&P 500 and the blue
line is our technology).
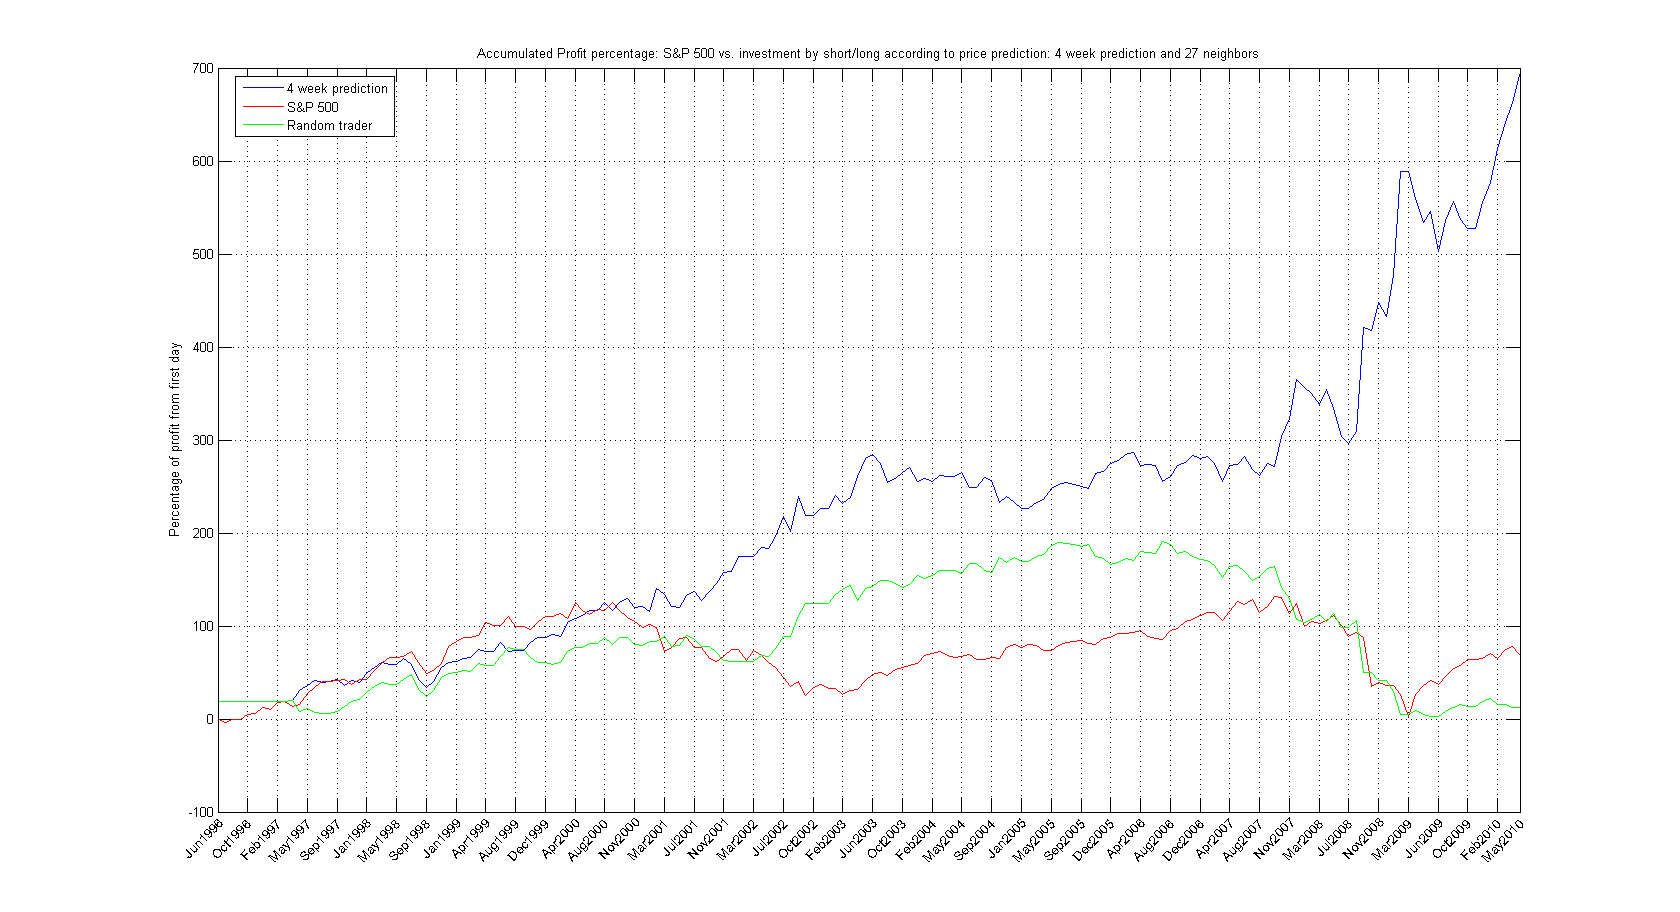
Since our trend prediction technology detected in advance the major crashes of the market on 2000 and 2008, we could maximize our profits.
As a result, starting from 2000, we constantly performed better than the S&P 500 and at the end of the test period we did more than 10 times better than the S&P.